Viruses are infectious agents with both living and non-living characteristics.
1. Living characteristics of viruses
a. They reproduce at a fantastic rate, but only in living host cells.
b. They can mutate.
2. Non-living characteristics of viruses
a. They are acellular, that is, they contain no cytoplasm or cellular organelles.
b. They carry out no metabolism on their own and must replicate using the host cell's metabolic machinery. In other words, viruses don't grow and divide. Instead, new viral components are synthesized and assembled within the infected host cell.
c. With few exceptions, they possess DNA or RNA but never both.
Viruses are usually much smaller than bacteria. Most are submicroscopic, ranging in size from 10-250 nanometers.
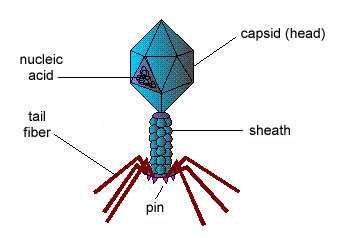
Structurally, viruses are much more simple than bacteria. Every virus contains a genome of single-stranded or double-stranded DNA or RNA that functions as its genetic material. This is surrounded by a protein shell called a capsid or core composed of protein subunits called capsomeres. Many viruses consist of no more than nucleic acid and a capsid, in which case they are referred to as nucleocapsid or naked viruses.
Most animal viruses have an envelope surrounding the nucleocapsid and are called enveloped viruses. The envelope usually comes from the host cell's membranes by a process called budding, although the virus does incorporate glycoprotein of its own into the envelope.
For more information on viral structure, see Viral Structure in my CourseArc lecture lessons.
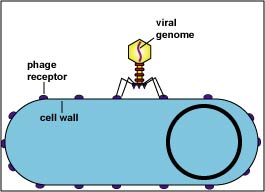
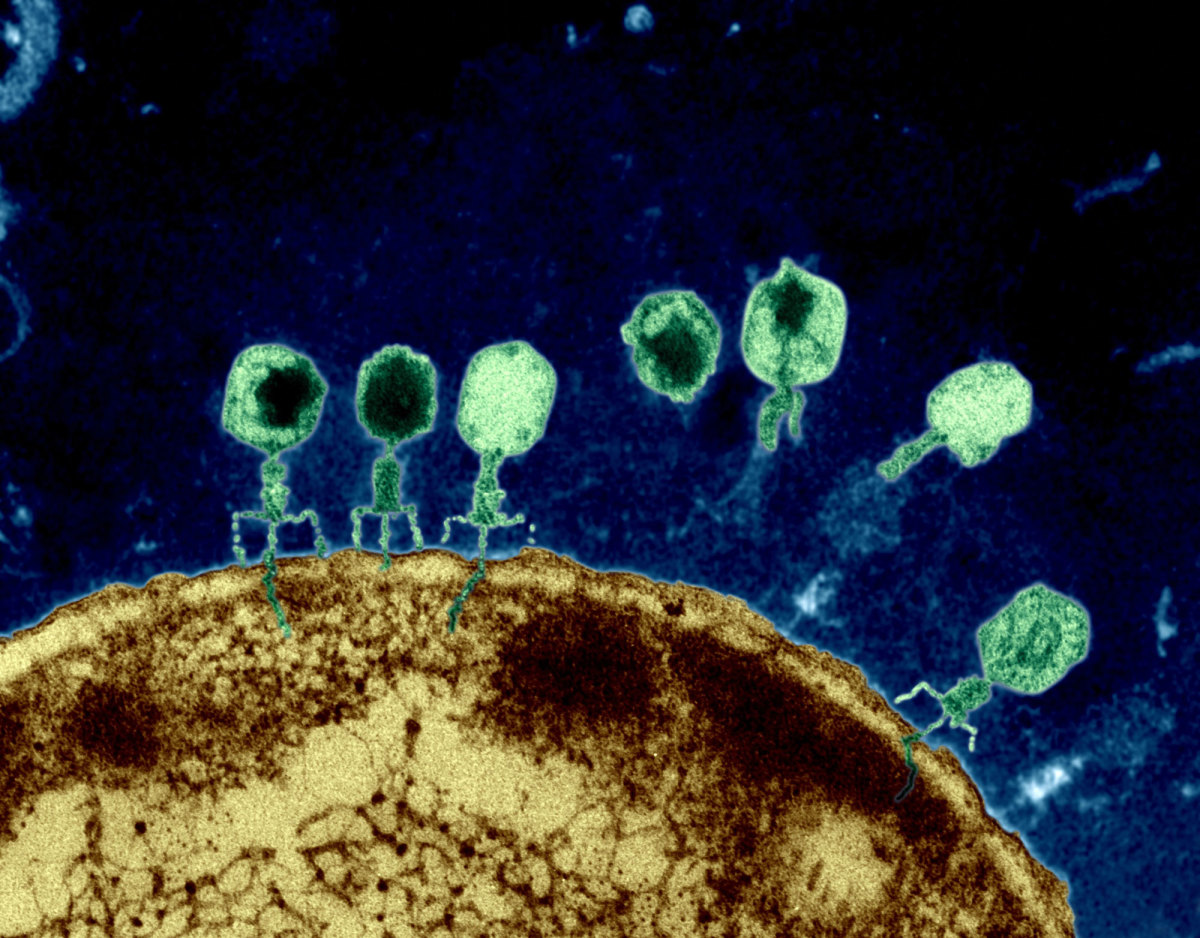
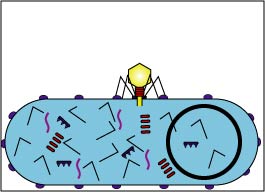
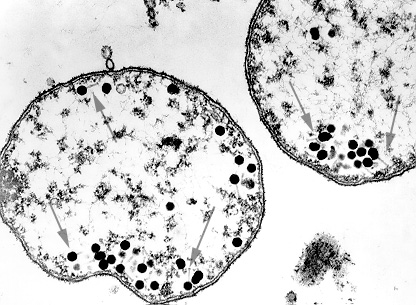
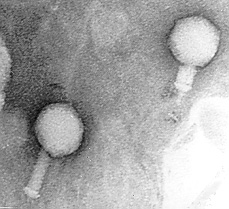
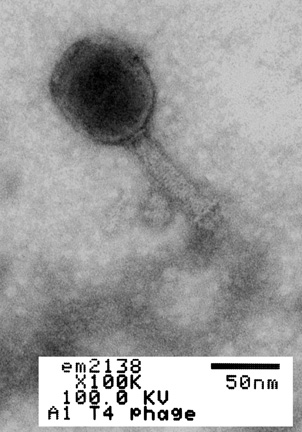
Bacteriophages are viruses that infect only bacteria (see Fig. 1A). In addition to the nucleocapsid or head, some have a rather complex tail structure (see Fig. 1B) used in adsorption to the cell wall of the host bacterium (see Fig. 1C). A Transmission electron micrograph of the coliphage T4 can be seen in Fig. 1D.
.
Fig. 1A: Bacteria infected with Bacteriophages
Fig. 1B: Transmission Electron micrograph of a bacteriophage with a contractile sheath
Fig. 1C: Bacteriophage Structure (Coliphage T-4)
Fig. 1D: Transmission Electron Micrograph of Coliphage T4
Most of the phages (arrows) have assembled.
Left = normal bacteriophage
Right = bacteriophage after contraction of sheath© Courtesy of Dr. Robert Burchard
Used with permission.© Courtesy of Dr. Robert Burchard
Used with permission.Gary E. Kaiser, Ph.D.
Professor of Microbiology
The Community College of Baltimore County, Catonsville Campus
This work is licensed under a Creative Commons Attribution 3.0 Unported License
Image courtesy of Louisa Howard. Public domain. Dartmouth EM Facility

Since viruses lack organelles and are totally dependent on the host cell's metabolic machinery for replication, they cannot be grown in synthetic media. In the laboratory, animal viruses are grown in animals, in embryonated eggs, or in cell culture. (In cell culture, the host animal cells are grown in synthetic medium and then infected with viruses.) Plant viruses are grown in plants or in plant cell culture. Bacteriophages are grown in susceptible bacteria.
Today we will be working with bacteriophages since they are the easiest viruses to study in the lab. Most bacteriophages, such as Coliphage T4 that we are using today, replicate by the lytic life cycle and are called lytic bacteriophages.
For more information on the lytic life cycle of bacteriophage, see The Lytic Life Cycle of Bacteriophage in my CourseArc lecture lessons.
The lytic life cycle of Coliphage T4 consists of the following steps:
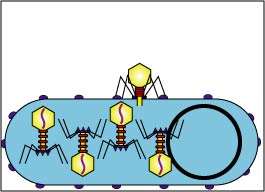
1. Adsorption (Fig. 2A and Fig. 2B).
Attachment sites on the bacteriophage tail adsorb to receptor sites on the cell wall of a susceptible host bacterium.
Fig. 2A: Adsorption during the Lytic Life Cycle of a Lytic Bacteriophage
Fig. 2B: Electron micrograph of Bacteriophages Adsorbing to a Bacterium
The bacteriophage binds to receptors on the bacterial cell wall.Gary E. Kaiser, Ph.D.
Professor of Microbiology
The Community College of Baltimore County, Catonsville Campus
This work is licensed under a Creative Commons Attribution 3.0 Unported License
By Dr Graham Beards (en:Image:Phage.jpg) [CC BY-SA 3.0 (https://creativecommons.org/licenses/by-sa/3.0) or GFDL (http://www.gnu.org/copyleft/fdl.html)], via Wikimedia Commons
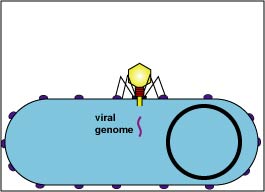
2. Penetration (Fig. 2C)
A bacteriophage enzyme "drills" a hole in the bacterial cell wall and the bacteriophage injects its genome into the bacterium. This begins the eclipse period, the period in which no intact bacteriophages are seen within the bacterium.
Fig. 2C: Penetration during the Lytic Life Cycle of a Lytic Bacteriophage
The bacteriophage injects its genome into the bacterium's cytoplasm.Gary E. Kaiser, Ph.D.
Professor of Microbiology
The Community College of Baltimore County, Catonsville Campus
This work is licensed under a Creative Commons Attribution 3.0 Unported License
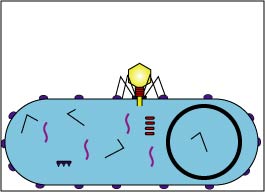
3. Replication (Fig. 2D and Fig. 2E)
Enzymes coded by the bacteriophage genome shut down the bacterium's macromolecular (protein, RNA, DNA) synthesis. The bacteriophage genome replicates and the bacterium's metabolic machinery is used to synthesize bacteriophage enzymes and bacteriophage structural components.
Fig. 2D: Early Replication during the Lytic Life Cycle of a Lytic Bacteriophage
Fig. 2E: Late Replication during the Lytic Life Cycle of a Lytic Bacteriophage
The bacteriophage genome replicates and bacteriophage components begin to be produced by way of the host bacterium's metabolic machinery.
The production of bacteriophage components and enzymes progresses.Gary E. Kaiser, Ph.D.
Professor of Microbiology
The Community College of Baltimore County, Catonsville Campus
This work is licensed under a Creative Commons Attribution 3.0 Unported License
Gary E. Kaiser, Ph.D.
Professor of Microbiology
The Community College of Baltimore County, Catonsville Campus
This work is licensed under a Creative Commons Attribution 3.0 Unported License
4. Maturation (Fig.2F)
The bacteriophage parts assemble around the genome.
Fig. 2F: Maturation during the Lytic Life Cycle of a Lytic Bacteriophage
The bacteriophage components assemble.Gary E. Kaiser, Ph.D.
Professor of Microbiology
The Community College of Baltimore County, Catonsville Campus
This work is licensed under a Creative Commons Attribution 3.0 Unported License
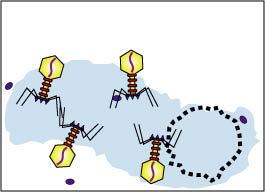
5. Release (Fig. 2G)
A bacteriophage-coded lysozyme breaks down the bacterial peptidoglycan causing osmotic lysis of the bacterium and release of the intact bacteriophages.
Fig. 2G: Release during the Lytic Life Cycle of a Lytic Bacteriophage
A bacteriophage-coded enzyme breaks down the peptidoglycan in the bacterial cell wall causing osmotic lysis.Gary E. Kaiser, Ph.D.
Professor of Microbiology
The Community College of Baltimore County, Catonsville Campus
This work is licensed under a Creative Commons Attribution 3.0 Unported License
6. Reinfection
From 50-200 bacteriophages may be produced per infected bacterium and they now infect surrounding bacteria.
Some bacteriophages replicate by the lysogenic life cycle and are called temperate bacteriophages. When a temperate bacteriophage infects a bacterium, it can either 1) replicate by the lytic life cycle and cause lysis of the host bacterium, or it can 2) incorporate its DNA into the bacterium's DNA and assume a noninfectious state. In the latter case, the cycle begins by the bacteriophage adsorbing to the host bacterium and injecting its genome, as in the lytic cycle. However, the bacteriophage does not shut down the host bacterium. Instead, the bacteriophage DNA inserts or integrates into the host bacterium's DNA. At this stage, the virus is called a prophage. Expression of the bacteriophage genes controlling bacteriophage replication is repressed by a repressor protein and the bacteriophage DNA replicates as a part of the bacterial nucleoid. However, in approximately one in every million to one in every billion bacteria containing a prophage, spontaneous induction occurs . The bacteriophage genes are activated and bacteriophages are produced as in the lytic life cycle. The lysogenic life cycle is summarized in Figs. 3A-3H.
For more information on the lysogenic life cycle of bacteriophage, see The Lysogenic Life Cycle of Bacteriophage in my CourseArc lecture lessons.
Today you will infect the bacterium Escherichia coli B with its specific bacteriophage, Coliphage T4.
In the first part of the lab you will perform a plaque count. A plaque (see Fig. 4) is a small, clear area on an agar plate where the host bacteria have been lysed as a result of the lytic life cycle of the infecting bacteriophages. As the bacteria replicate on the plate they form a "lawn" of confluent growth. Meanwhile, each bacteriophage that adsorbs to a bacterium will reproduce and cause lysis of that bacterium. The released bacteriophages then infect neighboring bacteria, causing their lysis. Eventually a visible self-limiting area of lysis, a plaque, is observed on the plate.
Fig. 4: Plaques on a 1/100,000 (10
-5 ) Dilution of Coliphage T-4Gary E. Kaiser, Ph.D.
Professor of Microbiology
The Community College of Baltimore County, Catonsville Campus
This work is licensed under a Creative Commons Attribution 3.0 Unported License
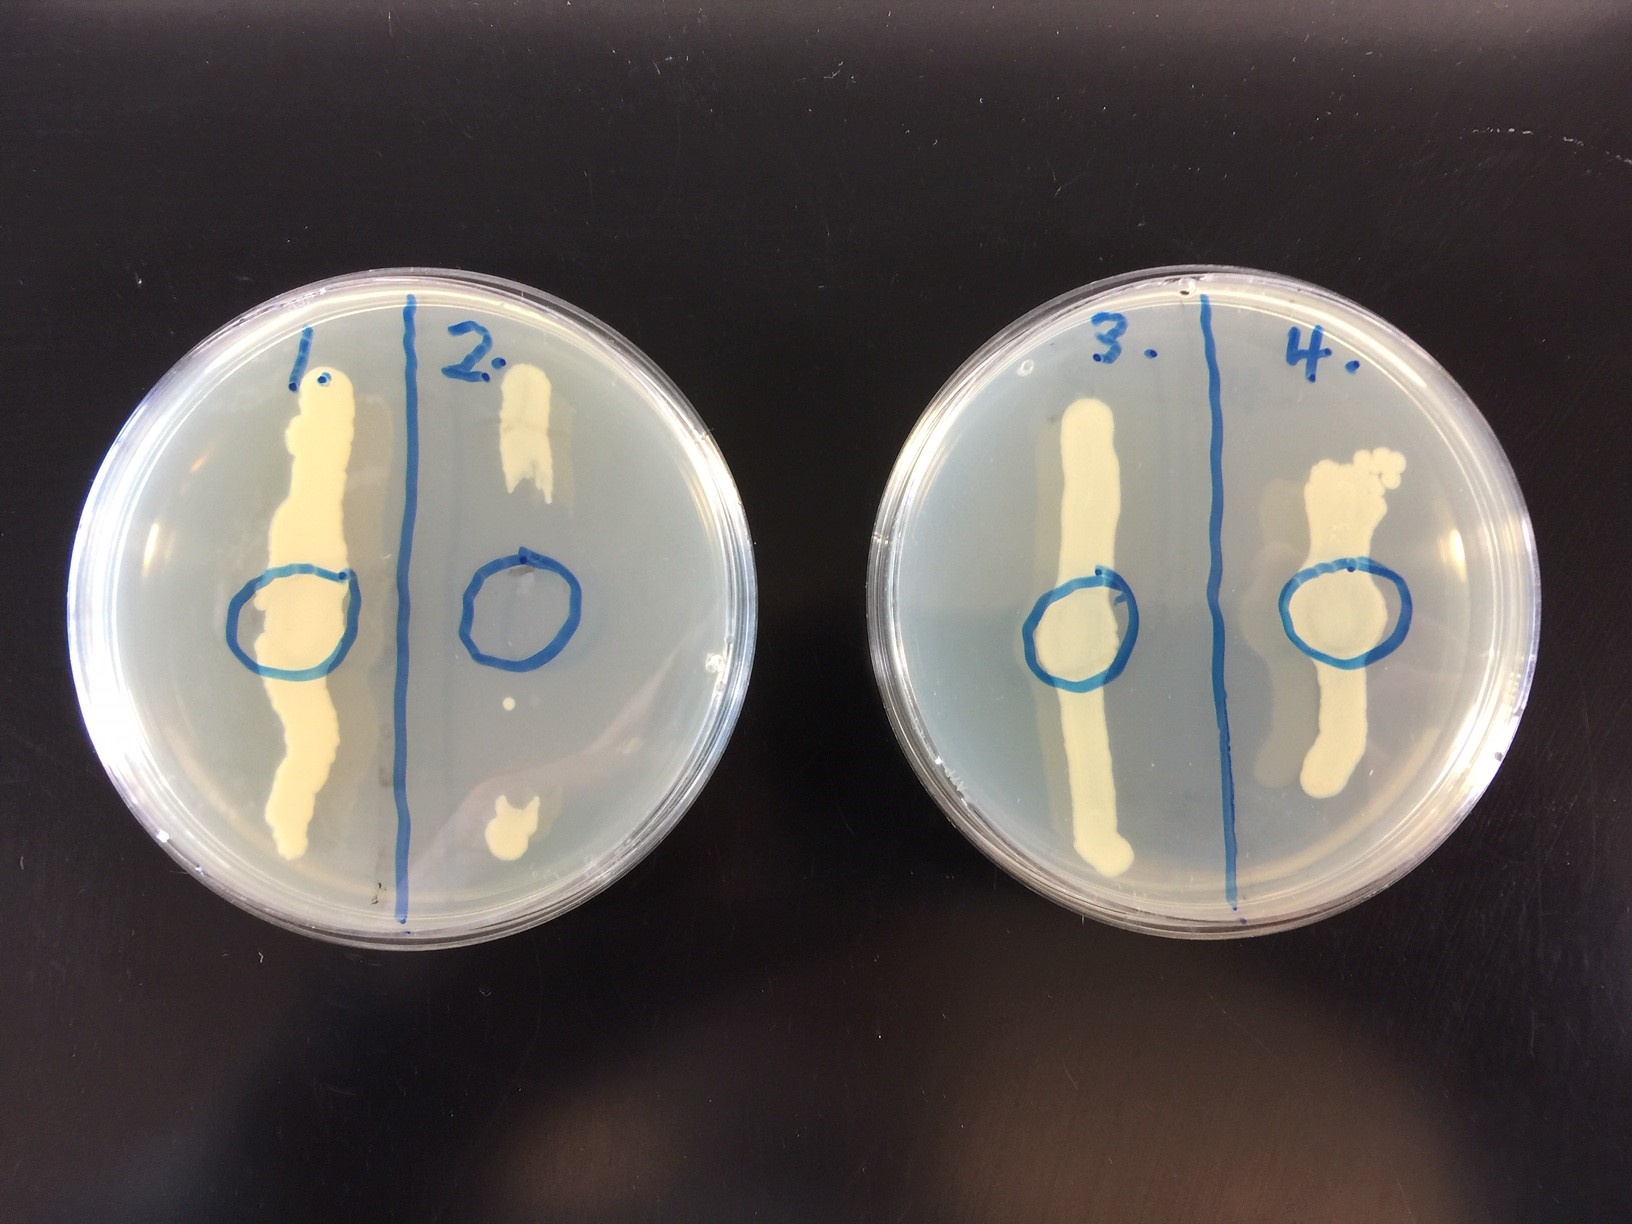
The second part of the lab will demonstrate viral specificity. Viral specificity means that a specific strain of bacteriophage will only adsorb to a specific strain of susceptible host bacterium. In fact, viral specificity is just as specific as an enzyme-substrate reaction or an antigen-antibody reaction. Therefore, viral specificity can be used sometimes as a tool for identifying unknown bacteria. Known bacteriophages are used to identify unknown bacteria by observing whether or not the bacteria are lysed. This is called phage typing.
Phage typing is useful in identifying strains of such bacteria as Staphylococcus aureus, Pseudomonas aeruginosa and Salmonella species. For example, by using a series of known staphylococcal bacteriophages against the Staphylococcus aureus isolated from a given environment, one can determine if it is identical to or different from the strain of Staphylococcus aureus isolated from a lesion or from a food. This can be useful in tracing the route of transmission.
A. PLAQUE COUNT
MATERIALS
1 tube containing 9.9 ml of sterile saline; 3 tubes containing 9.0 ml of sterile saline; 3 sterile empty dilution tubes; 3 Trypticase Soy agar plates; 3 sterile 1.0 ml pipettes; 1 sterile 10.0 ml pipette; bottle of melted Motility Test Medium from a water bath held at 47C.
CULTURES
Trypticase Soy broth culture of Escherichia coli B, suspension of Coliphage T4.
PROCEDURE (to be done in groups of three)
Videos reviewing techniques used in this lab:
How to Read and Aseptically Handle a Sterile 1 milliliter (ml) Pipette
How to Pipette Using Aseptic Technique and use a Vortex Mixer
How to Read and Aseptically Handle a Sterile 10 milliliter (ml) Pipette
1. Take 1 tube containing 9.9 ml of sterile saline, 3 tubes containing 9.0 ml of sterile saline, and 3 sterile empty dilution tubes and label the tubes as shown in Fig. 5. Label the 3 TSA plates 10-4, 10-5, and 10-6.
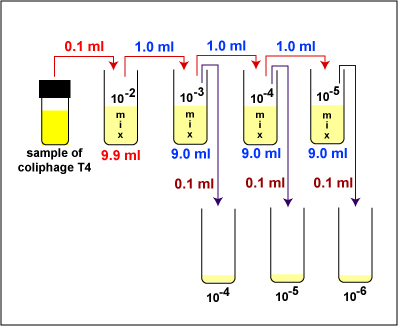
2. Dilute the Coliphage T4 stock as described below and shown in Fig. 5.
Fig. 5: Dilution of Coliphage T-4 for the Plaque Count Experiment
Gary E. Kaiser, Ph.D.
Professor of Microbiology
The Community College of Baltimore County, Catonsville Campus
This work is licensed under a Creative Commons Attribution 3.0 Unported License
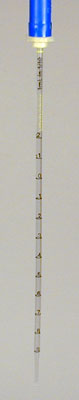
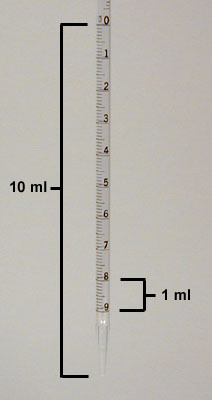
a. Remove a sterile 1.0 ml pipette from the bag. Do not touch the portion of the pipette that will go into the tubes and do not lay the pipette down. From the tip of the pipette to the "0" line is 1 ml; each numbered division (0.1, 0.2, etc.) represents 0.1 ml; each division between two numbers represents 0.01 ml (see Fig. 6).
Fig. 6: A 1.0 Milliliter (ml) Pipette
The 1.0 ml pipette uses the blue pipette filler. The divisions are shown in the right-hand photograph.Gary E. Kaiser, Ph.D.
Professor of Microbiology
The Community College of Baltimore County, Catonsville Campus
This work is licensed under a Creative Commons Attribution 3.0 Unported License
b. Insert the cotton-tipped end of the pipette into a blue 2 ml pipette filler.
c. Uncap the sample of Coliphage T4, insert the pipette to the bottom of the tube, and withdraw 0.1 ml (see Fig. 6 above) of the sample by turning the filler knob towards you. Recap the tube.
d. Place the lip of the 10-2 dilution tube at the opening of the microincinerator for 2-3 seconds and dispense the 0.1 ml of Coliphage T4 into the tube by turning the filler knob away from you. Draw the liquid up and down in the pipette several times to rinse the pipette and help mix. Flame and cap the tube. This will give a 1/100 or 10-2 dilution of the bacteriophage.
e. Using a vortex mixer, mix the tube thoroughly. This is to assure an even distribution of the bacteriophage throughout the liquid.
f. Using the same pipette and procedure, aseptically withdraw 1.0 ml (see Fig. 6 above) from the 10-2 dilution tube and dispense into the 10 -3 dilution tube. This will give a 1/1000 or 10-3 dilution of the bacteriophage. Using a vortex mixer, mix the tube thoroughly.
g. Using the same pipette and procedure, aseptically withdraw 1.0 ml (up to the "0" line; see Fig. 6 above) from the 10-3 dilution tube and dispense into the 10-4 dilution tube. This will give a 1/10,000 or 10-4 dilution of the bacteriophage. Using a vortex mixer, mix the tube thoroughly.
h. Using the same pipette and procedure, aseptically withdraw 1.0 ml (see Fig. 6 above) from the 10-4 dilution tube and dispense into the 10-5 dilution tube. This will give a 1/100,000 or 10-5 dilution of the bacteriophage. Using a vortex mixer, mix the tube thoroughly.
i. Discard the pipette in the used pipette container.
3. Take 3 empty, sterile tubes and treat as described below and shown in Fig. 7.
a. Using a new sterile 1.0 ml pipette and the procedure described above, aseptically remove 0.1 ml of the 10-5 bacteriophage dilution and dispense into the10-6 empty tube.
b. Using the same pipette and procedure, aseptically remove 0.1 ml of the 10-4 bacteriophage dilution and dispense into the 10-5 empty tube.
c. Using the same pipette and procedure, aseptically remove 0.1 ml of the 10-3 bacteriophage dilution and dispense into the 10-4 empty tube.
d. Discard the pipette in the used pipette container.
Fig. 7: Adding the Diluted Coliphage T4 to the 3 Sterile Culture Tubes
Gary E. Kaiser, Ph.D.
Professor of Microbiology
The Community College of Baltimore County, Catonsville Campus
This work is licensed under a Creative Commons Attribution 3.0 Unported License
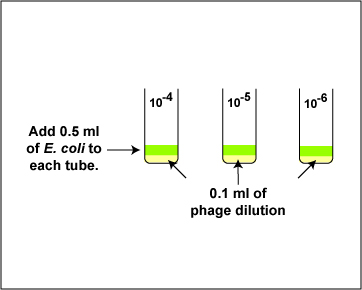
4. Using a new sterile 1.0 ml pipette, add 0.5 ml (see Fig. 6 above) of E. coli B to the 0.1 ml of bacteriophage in each of the 3 tubes from step 3 as shown in Fig. 8. Using a vortex mixer, mix the tube thoroughly. Discard the pipette in the used pipette container.
Fig. 8: Adding the E.coli in the Plaque Count Experiment
Gary E. Kaiser, Ph.D.
Professor of Microbiology
The Community College of Baltimore County, Catonsville Campus
This work is licensed under a Creative Commons Attribution 3.0 Unported License
5. Let the 3 tubes of E. coli / coliphage T4 mixture sit for 10-15 minutes to promote adsorption.
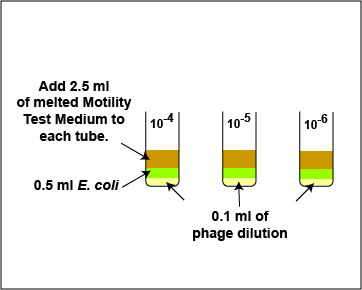
6. Using a sterile 10.0 ml pipette, add 2.5 ml (see Fig. 9) of sterile, melted Motility Test Medium to the E. coli / bacteriophage mixture in each of the 3 tubes from step 4 as shown in Fig. 10. Using a vortex mixer, mix the tube thoroughly. Discard the pipette in the used pipette container.
Fig. 9: A 10 Milliliter (ml) Pipette
Fig. 10: Adding the Melted Motility Test Medium in the Plaque Count Experiment
Gary E. Kaiser, Ph.D.
Professor of Microbiology
The Community College of Baltimore County, Catonsville Campus
This work is licensed under a Creative Commons Attribution 3.0 Unported License
Gary E. Kaiser, Ph.D.
Professor of Microbiology
The Community College of Baltimore County, Catonsville Campus
This work is licensed under a Creative Commons Attribution 3.0 Unported License
7. Quickly pour the melted Motility Test Medium / E. coli / bacteriophage mixtures onto separate plates of Trypticase Soy agar and swirl to distribute the contents over the entire agar surface.
8. Incubate the 3 TSA plates right side up and stacked in the petri plate holder on the shelf of the 37°C incubator corresponding to your lab section until the next lab period.
B. VIRAL SPECIFICITY
MATERIALS
Trypticase Soy agar plates (2)
CULTURES
Trypticase Soy broth cultures of 4 unknown bacteria labeled #1, #2, #3, and #4; suspension of Coliphage T4.
PROCEDURE (to be done in groups of three)
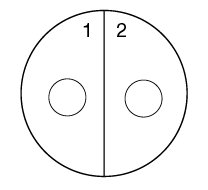
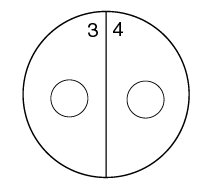
1. Using a wax marker, draw a line on the bottom of both Trypticase Soy agar plates dividing them in half. Number the 4 sectors 1, 2, 3, and 4, to correspond to the 4 unknown bacteria.
2. Draw a circle about the size of a dime in the center of each of the 4 sectors (see Fig. 11).
Fig. 11: Viral Specificity Label your 2 TSA plates as shown below.
Gary E. Kaiser, Ph.D.
Professor of Microbiology
The Community College of Baltimore County, Catonsville Campus
This work is licensed under a Creative Commons Attribution 3.0 Unported License
Gary E. Kaiser, Ph.D.
Professor of Microbiology
The Community College of Baltimore County, Catonsville Campus
This work is licensed under a Creative Commons Attribution 3.0 Unported License
3. Using a sterile inoculating loop, streak unknown bacterium #1 on sector 1 of the first Trypticase Soy agar plate by streaking the loop through the circle you drew. Be careful not to streak into the other half of the plate.
4. Streak unknown bacterium #2 on sector 2 of the first Trypticase Soy agar plate.
5. Streak unknown bacterium #3 on sector 3 of the second Trypticase Soy agar plate.
6. Streak unknown bacterium #4 on sector 4 of the second Trypticase Soy agar plate.
7. Have your instructor add 1 drop of concentrated Coliphage T4 to each sector in the area outlined by the circle.
8. Incubate the 2 TSA plates right side up and stacked in the petri plate holder on the shelf of the 37°C incubator corresponding to your lab section until the next lab period.
RESULTSA. Plaque Count
Observe the 2 plates for plaque formation and make a drawing.
B. Viral Specificity
Make a drawing of your results and state which of the unknowns (#1, #2, #3, or #4) was E. coli.
PERFORMANCE OBJECTIVES FOR LAB 11
After completing this lab, the student will be able to perform the following objectives:
DISCUSSION
1. Define the following: bacteriophage, plaque, and phage typing.
2. Describe the structure of the bacteriophage coliphage T4.
3. Describe the lytic life cycle of bacteriophages.
4. Define viral specificity.
RESULTS
1. Recognize plaques and state their cause.
2. Interpret the results of a viral specificity test using Coliphage T4.
SELF-QUIZ
Microbiology Laboratory Manual by Gary E. Kaiser, PhD, Professor of Microbiology
is licensed under a Creative Commons Attribution 4.0 International License.
Last updated: April, 2023