Section 1-2 - Kinematics in One
Dimension
Displacement
&
Distance
Velocity
and Speed
Acceleration and Jerk
Kinematic Equations
Acceleration due to Gravity
A Different Graphical Interpretation
Discussion
of
Misconceptions
and
the Act of Misconceiving
Correlation
to
Textbook
Displacement
and
Distance
Kinematics is the study of
the
motion (same root as cinema) of an object, without regard to
the
causes of that motion.
We'll need first of all to be
able
to define the location of an object. In one dimension, we
can consider the 'numberline' axis discussed in the last section and
use
the variable 'x' to label the position relative to the origin in
metres,
so that the statements 'x = +3 m' and 'x = -7.46 m' mean that the
object
is 3 m from the origin in the positive direction (not necessarily to
the
right of it, though!) and 7.46 m from the origin in the negative
direction,
respectively.
We also need to be able to describe
the change in location of an object. We define the displacementDx
of an object which started at xi and ended up at xf as
Dx =
xf - xi.
Note that, according to this
definition,
the displacement depends only on where the object started and ended,
not
on the path taken.
Examples: Suppose that an
object starts out at xi = 3 and ends at xf = 5,
and
makes that trip smoothly and without reversing direction. What is
the displacement? Now, suppose instead that the object travels
from
x = 3 to x = 15, then back to x = - 8, then on to x = 5. What is
the displacement in that case?
Suppose instead that the object
moved from x = 5 to x = 3. What then would be the displacement?
Is the displacement a scalar or
vector quantity?
Suppose that Object 1 moves from x = 5 m to x = 9 m, while Object 2
moves from x = 7 m to x = 11 m. Which object had the larger
displacement?
Distance (s) is the term we use for the length of the path
taken.
So long as the direction of motion doesn't change, the distance is the
same as the magnitude of the displacement.
Examples: Suppose that an
object starts out at xi = 3 and ends at xf = 5,
and
makes that trip smoothly and without reversing direction. What is
the distance? Now, suppose instead that the object travels from x
= 3 to x = 15, then back to x = - 8, then on to x = 5. What is
the
distance in that case?
Velocity
and
Speed
Often, we want to know how quickly
an
object gets from one spot to another. If we say that the object
is
at position xo at time to, and arrives at
position
xf at time tf , then we can define the average
velocity to be the displacement per unit time, or
vaverage = [xf
- xi]/[tf
- ti] = Dx/Dt.
Is the average velocity a vector
or a scalar?
Find the average velocity in each
of the cases below:
Suppose that an object starts out
at xi = 3 and ends at xf = 5, and makes that
trip
smoothly and without reversing direction in 3 seconds.
Suppose instead that the object
travels from x = 3 to x = 15, then back to x = - 8, then on to x = 5,
all
in 3 seconds.
Average speed is defined
as
the distance traveled per unit time, or speed = s/Dt.
Find the average speed in these examples.
Suppose that an object starts out
at xi = 3 and ends at xf = 5, and makes that
trip
smoothly and without reversing direction in 3 seconds.
Suppose instead that the object
travels from x = 3 to x = 15, then back to x = - 8, then on to x = 5,
all
in 3 seconds.
Try another example:
Jimmy walks across the room (10
m) in 10 seconds, and runs back in 5 seconds.
What is his displacement?
What is his total distance?
What is his average velocity?
What is his average speed walking
across the room?
What is his average speed running
back?
What is his overall average speed?
Why was my answer wrong?
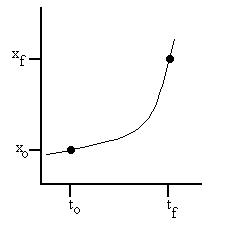
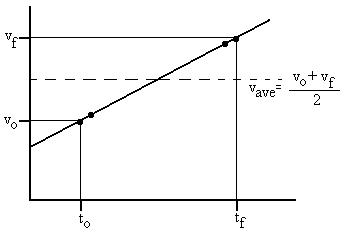
The average velocity discussed
above
is considered over an interval of time. How can we find the instantaneous
velocity, the velocity at an instant of time? Consider the
following
graph, which shows the position of an object as a function of time,
x(t):
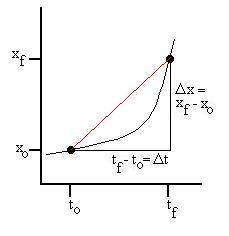
How would the average velocity between to and tf be
represented
on
this
graph?
vave = Dx/Dt
=
[xf - xi]/[tf - ti] =
rise
over run = slope of the line connecting the two points.
How to find the velocity at time ti? Let's decrease
the interval:
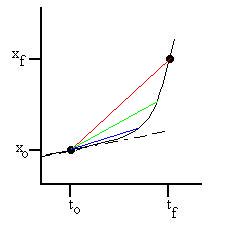
As the interval becomes smaller, the average velocity approaches the
instantaneous velocity, or graphically, the slope representing the
average
velocity approaches the slope of the line tangent to the x(t) curve at
the point at which we wish to know v(t). Mathematically, we write
this as
vinstantaneous = limit Dt->0Dx/Dt.
We can do the same with the instantaneous
speed:
inst speed = limit Dt->0 s/Dt.
We then see that, for infinitely short time intervals, an object
doesn't
have time to reverse direction, and so the instantaneous speed is the
same
as the magnitude of the instantaneous velocity.
Acceleration and Jerk
We define the average acceleration as the change in velocity
per
unit time:
aave = Dv/Dt,
and the instantaneous acceleration as
ainst = limit Dt->0Dv/Dt.
The analysis is the same for a as it was for v, so the work will not
be repeated here. Suffice it to state that the instantaneous
acceleration
can be found graphically by finding the slope of the line tangent to
the
v(t) curve.
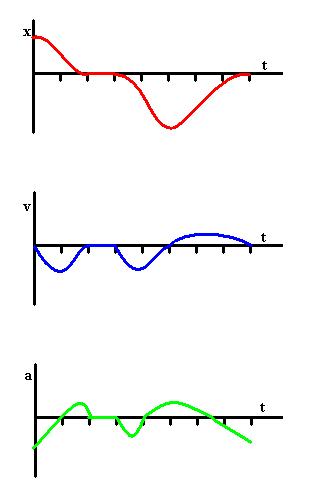
We did an exercise with a randomly drawn x(t) curve, and sketched
v(t) and a(t).
We can continue the process indefinitely. For example, the average
jerk is defined as
jave = Da/Dt,
and the instantaneous jerk is
jinst = limit Dt->0Da/Dt,
and so on with the kick and then the lurch:
kave = Dj/Dt,
the
instantaneous kick is
kinst = limit Dt->0Dj/Dt,
lave = Dk/Dt,
the
instantaneous lurch is linst = limit Dt->0Dk/Dt.
The acceleration, jerk, kick, and lurch are all vector quantities.
Kinematic Equations
Let's use these definitions to derive some possibly useful
relationships.
We shall assert the following:
- that the acceleration is constant, at least over some interval
in which
we are interested.
- that the problem starts at ti = 0, so that we can
just drop
that term.
- that all final quantities (tf, xf, vf)
can
be
replaced
with the more general corresponding variables (t,
x, v).
In this way, for example, Dt = tf -
ti = t.
Start with the definition of the acceleration (since the
acceleration
is constant, that value is also the average value):
a = [v - vo]/[t - ti] = [v - vi]/t,
which re-arranges to
v = vi + at.
Strictly speaking, this is true so long as a is the average
acceleration.
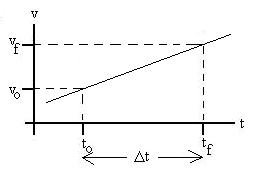
Before we continue, we need to develop a new relationship.
Consider
the v(t) graph below:
The curve is a straight line, because the acceleration is constant
and is represented by the slope of the curve; it may well have been a
negative
slope, or even a zero slope, instead of the positive slope pictured
here.
We need to average the infinitely many values the velocity has in the
interval
ti to tf.
We can do it without calculus if
we're a little
clever: First, average just the two endpoints to get [vi
+ vf]/2.
Now, average the points just above vo by an amount e
and just below vf by the same amount e
to
get
[(vi + e) + (vf - e)]/2 = [vi
+ vf]/2.
So e can have any value and result in the
same average value for any given pair of symetrically placed
points.
Since the overall average is the average of the pairs' averages, it
should
be clear that the overall average will also be
[vi + vf]/2.
So, for periods of constant acceleration, vave = [vi
+ v]/2.
Let's start again with the
definition of average
velocity,
vave = (x - xi)/t,
which re-arranges to
x = xi + vavet.
Now, substitute the new expression for vave to get
x = xo + ([vi + v]/2)t.
Previously, we showed that
v = vi + at.
Let's substitute this expression into the one above it
x = xi + ([vi + vi
+ at]/2)t
and simplify:
x = xi + vit + 1/2at2.
Let's start again with the definition of the average acceleration:
a = [v - vi]/t,
which we can re-arrange to be
t = [v - vi]/a.
Remember that
vave = [v + vi]/2.
Now, substitute each of these into
x = xi + vavet.
x = xi + ([v + vi]/2)([v
- vi]/a)
Now, simplify to get
x = xi + [v2 - vi2]/2a.
Re-arrange to obtain
v2 = vi2 + 2a(x - xi).
Now, we have four kinematic equations that are valid in the
special
case of constant acceleration:
v = vi + at
vave = [vi + v]/2
x = xo + vit + 1/2at2
v2 = vi2 + 2a(x - xi) |
Various combinations and perturbations of these should allow for
solving
most problems. Here, however, is a warning: do not rely on the
equations
by themselves to solve problems. The equations are in a sense
tools,
but it still requires the brain to direct their use.
Example:
A distracted driver traveling at 15 m/s notices a stop sign when he
is 10 m from the stop line. If the car decelerates at 6 m/s2,
how
quickly
is
the car moving as it passes the stop line?
Let's write down the quantities which we know either implicitly or
explicitly,
as well as what we want to figure out:
Let positive x be in the direction the car is moving and the origin
be where the driver first applies the brakes.
xi = 0 m
xf = 10 m
vi = 15 m/s
vf = ?
a = - 6 m/s2 (a deceleration of 6 m/s2 is an
acceleration of -6 m/s2, since a velocity becoming less
positive
is the same as one becoming more negative).
Since the kinematic equations are really all the same relationships
presented in slightly different forms, we can look for one which
contains
all of the quantities above. Sometimes this works, sometimes not;
in this case we're lucky:
vf2 = vo2 + 2a(x -
xo),
and in fact, not much algebraic manipulation is necessary:
vf2 = vo2 + 2a(x -
xo) = 152 + 2(-6)(10) = 105
vf = 1051/2 = 10.2 m/s
Note that we took the positive root of 105. Strictly speaking,
the math will only give us the final speed in this case; we need to use
our brains to determine the sign (and hence the direction) of the final
velocity.
Let's ask a slightly different problem. How far into teh
intersection does the car actually stop? The values we use for
this are then
xo = 0 m
xf = ?
vo = 15 m/s
vf = 0 m/s
a = - 6 m/s2
Since we have the same pieces of data, as in the last example, let's
try the same equation:
vf2 = vo2 + 2a(x -
xo)
x = xo + (vf2 - vo2
)/2a = 0 + (02 - 152 )/2(-6) =
18.75 m.
However, this is not the answer! We were asked how far into the
intersection te car stops, but thsi 18.75 m is measured from where the
brakes were first applied. The correct answer is 8.75 m into the
intersection.
Mastery Question
A train moving at 15 m/s passes the origin (xi = 0) at ti
= 0. At that instant, the engineer hits the brakes, giving the
train
an acceleration of - 0.5 m/s2, so that it comes to a
stop.
Where is the train after 40 seconds?
Click
here for the solution.
What should we do when the acceleration is not constant? So
long
as it is constant over intervals and changes abruptly, we can treat
each
individual interval as above, using the final values of the quantities
in one interval as the initial values for the next interval. See,
for example, Problem 2-7.
Acceleration due to Gravity
In the very special case of an object moving freely near the surface of
the earth under no other influence except the earth's gravity, the
acceleration
of the object will be 9.8 m/s2 downward. You
verified
this in a laboratory exercise. Your text probably refers to this
quantity as the acceleration due to gravity, g. I
would
prefer that for now you use the symbol ag, reserving g for
the
strength of the gravitational field, which we shall discuss in Section
4.
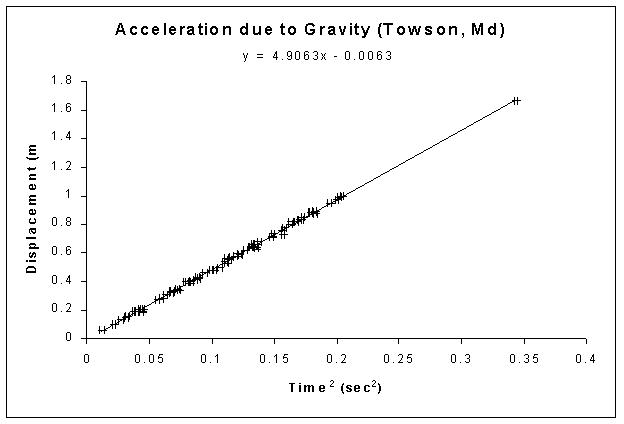
The results of an experiment by the Fall 2003 PHY542 class are shown
below. After dropping a mass from rest (vi = 0)
through
vertical displacement h and measuring the travel time, the data were
plotted
as h vs t2. If the kinematic relationships are
true, the slope of this curve represents half of the acceleration due
to
gravity, ag. A value of 9.8126 m/s2 is
within
about 0.14% of the accepted value in Towson.
In most problems, you may feel free to use 10 m/s2 as the
value for ag.
Example:
Let's drop a water balloon on someone's head from the top of a 20m tall
building. How quickly will the balloon be moving at the bottom
and how long will it take to arrive there?
Let up be positive and the origin be the top of the building.
Then,
xi = 0 m
xf = -20 m
vi = 05 m/s
vf = ?
a = -10 m/s2
t = ?
Again, let's check to see if there is a single kinematic equation
that will give us the answer, and there is:
vf2 = vi2 + 2a(x -
xi),
vf2 = vi2 + 2a(x -
xi) = 02 + 2(-10)(-20) = 400
vf = 4001/2 = -20 m/s
We must take the negative
root here, because the balloon is moving in the negative direction at
the end of the problem. The equation doesn't know to do that; we
need to keep an eye out.
As for the time, the shortest path is to make use of the final velocity
above and use
v = vi + at
t = (v - vi)/a = (-20 - 0)/(-10) = 2 seconds.
Or we might have used
x = xi + vit + 1/2at2
-20 = 0 + 0t + 1/2(-10)t2
t2 = (-2)/(-5) = 4
t = +2 seconds
We take the positive root because the balloon hits the ground after
it's dropped.
Example with solution:
A ball is thrown from the street such that it rises past a 25m high
window ledge at 12 m/s. Find a) the velocity with which it was
launched,
b) the maximum altitude above the street it reaches, c) how long ago it
was thrown, and d) the time until it returns to the ground. Click
here for solution.
A Different Graphical Interpretation
Consider a special case of an object moving with constant velocity in
one
dimension:
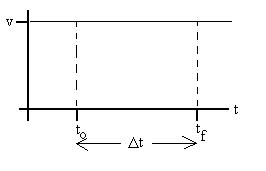
We've already defined the average velocity (or in this particular case
just the plain old velocity, since it's constant) as
v = Dx/Dt = [x
- xi]/[tf - ti].
From this relationship,we see that the displacement is given by
Dx = v Dt.
How is this quantity represented on the graph?
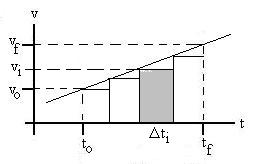
What about other cases? Let's
try constant
but non-zero acceleration, i.e., the velocity is represented by
a straight but not horizontal line:
Since the velocity is not constant, we can not use the trick above,
but we can use a craftier one: Let's break the time interval up
into
many very small time intervals, Dtn (n
is
just
an
index, i.e., if n = 23, we're talking about the 23rd
such interval), so that the velocity is almost constant over
each.
Then the displacement over each interval, Dxn
, is vn Dtn ,
and
the total displacement should be
Dx = Sn
Dxn = Snvn Dtn.
Graphically, this is the sum of the areas of each of the little
rectangles
in the figure.
Of course, in this example, we are always underestimating the
displacement,
because we're multiplying Dt by the (lower
than
average) initial velocity of each interval. So, we want to make
as
many intervals as possible, each over as small a time interval as
possible,
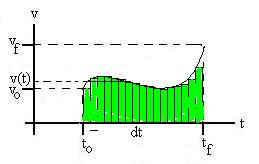
to reduce this error. As we let the number of intervals go
towards
infinity, we can see that the little triangles atop each rectangle get
smaller and smaller, and that the total rectangle area we are counting
tends toward the total area under the line. So we see that the
total
displacement will be represented on such a graph as the area under the
curve.
Since the original shape was a trapezoid, the area of which
is
1/2[h1 + h2]b,
the displacement will be
1/2[vi + vf] Dt.
Can we verify this from what we already knew? The displacement
(by re-arrangement of a definition) is Dx =
vave Dt. But we calculated
vave for constant acceleration mathematically:
vave = [vf + vi]/2.
So,
Dx = vave Dt
= ([vf + vi]/2) Dt
as expected.
We can generalize this result for any shape of curve:
Also, we can use exactly the same argument to assert that the area
under
the acceleration vs time curve is the change in
velocity.
That bears repeating: we can't get the velocity from the curve, only thechange
in velocity, in the same way that we got the displacement, the change
in position, for the v vs t curve, not the object's position
itself.
Here is a quick example:
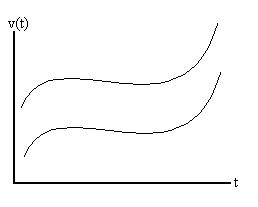
Each of the two curves shown will generate the same acceleration curve,
since the slopes of the two are the same for each value of time,
t.
So, given a particular acceleration curve, it would be impossible for
one
to determine which of an infinite number of velocity curves it was
derived
from.
Let's look at another situation:
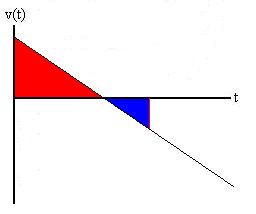
In this case, the velocity starts out positive, but there is a negative
acceleration (slope of the line). Eventually, the velocity
becomes
zero and the object comes momentarily to rest, having traveled through
a displacement represented by the area under the curve (the red
area).
As time progresses, we see that the velocity becomes negative, the
object
reverses direction, and we would expect that it may well arrive back at
its starting point, for a total displacement of zero. How does
this
play out on the graph? Since displacement is basically velocity
times
time interval, negative velocities result in negative inceremental
displacements
which are represented by negative area (blue). So, in this
example,
when the positive (red) area above the axis equals the negative (blue)
area under the axis, the total displacement will be zero and the object
will have returned to its starting point.
Consider a mass oscillating on a spring:
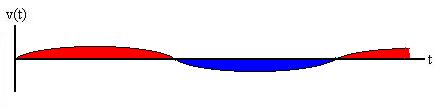
Once again, when the area 'under' the curve adds to zero, the object
has returned to its starting point.
Discussion
of
Misconceptions
and
the
Act of Misconceiving
Generally, it is fultile to discuss the 'misconceptions' suffered by
students
in physics, since the real problem usually is not any particular
misconception,
but rather the act of misconceiving. Students really do
need
to work through the material, make mistakes, and learn to think for
themselves.
Part of this process is to decide which model will be the most
appropiate
for a given situation, and under what conditions the model chosen is
valid.
Eventually, this all gets internalized, and the student learns.
In
that sense, it is impossible for the faculty to teach physics, rather
we
can only hope to set up an environment which will help the students
learn.
Having said that, here is some further discussion which may clarify
some confusion:
Ball dropped from a rising helicopter (see Problem 2-8):
Many students believe that the ball begins to descend immediately upon
its release from the rising helicopter. This is not so. Try
lifting a pen upward with your hand palm down, releasing it as it
passes
some point on the wall. If that notion is correct, the pen will
never
appear above that spot on the wall, but you will see that it does
indeed
continue to rise. For some reason, it's easier to believe when
you
push the pen with palm upward, so be sure to hold palm downward to more
closely simulate the scenario in the problem. Graphically, we see
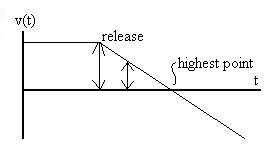
We see at first the constant velocity experienced while the ball is
still connected to the helicopter. At the release time, the
acceleration
becomes -9.8 m/s2, as shown by the negative slope of the
line.
A short time later, the velocity is still positive, although less than
it was, but a positive velocity still means that the object is rising,
and it will continue to do so until the velocity reaches zero at the
highest
point in the trajectory.
Speaking of that highest point, what is the acceleration at that
point?
It is common to assume that it is zero, but that confuses that velocity
with the acceleration. We can look at the graph above and see
that
the slope of the v(t) graph when v = 0 is still -9.8 m/s2.
Or,
think
opf
the velocity just before the peak (positive) and just
after
the peak ( negative); the acceleration measures the change in velcoity,
which became more negative in that time interval. Or think of it
this way, since acceleration is related to the change in velocity, if ag
were
zero at the peak, what would the object do? No acceleration
implies
no change in velocity, so the object would just hang in space, an event
counter to our experience.
Return to Class Notes Directory
Proceed to Next Section of Notes
D Baum 9/2003